Aman Kumar
Joined - December 2024
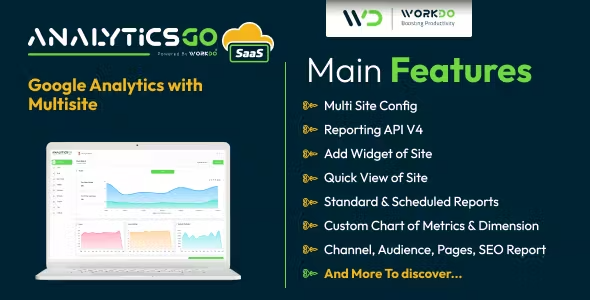
What to expect from AnalyticsGo SaaS – Google Analytics V4 with Multisite
Salient Features of AnalyticsGo SaaS – Google Analytics V4 with Multisite Create plans and get payment – a unique SaaS Feature
With a Super Admin Login, create the most feasible plans for your business model. Select appropriate pricing and duration for the created plan. Make payments using various payment gateways. The plan would be disabled if not renewed after its expiry.
Dashboard
A well-organized dashboard that represents the weekly/ monthly/ yearly graphs of new visitors and returning visitors for analyzing consistency. It also pictures live active users from diverse locations as well as the sessions from the devices used along with the session durations and clicks on the active pages.
Add Credential File
The credential file here is to add the very first step for the websites to work. To move ahead with this, the credential file is to be added from the console.cloud. After filling in the required details of the OAuth account, a unique JSON file will be generated. The user has to download and submit the file for further processing.
Add Site
This feature of AnalyticsGo SaaS helps to add more than one websites which already been created in Google Analytics with their Account, Property, and View details according to the requirements of the website(s).
Assign roles to each user
Our multi-user accounting tool allows you to assign roles to each of your staff. By managing their permissions gain control over their access to certain parameters.
Realtime API V4
Get user activity occurring on websites right now. Real-time reports are updated within seconds so you can build live dashboards to monitor how users interact with your websites at any moment.
Quick View
The quick view feature allows the user to have a graphical representation in line or bar graphs of your multiple websites. The specific value can be seen by hovering over the graph. The graphs can be modified in following the needs of the user more likely, according to the Websites, Time frame, Top and Bottom Left and Right with the already provided matrix. The color of the Chart can also be changed by the user from the Color picker.
The most important use of the quick view feature, in this case, is to assist the user in comparing multiple websites using the various matrices that Google Analytics has already provided. The websites can be compared using multiple criteria determined by the user.
Get the updates, offers, tips and enhance your page building experience
Up to Top


Comments